CandlestickChart


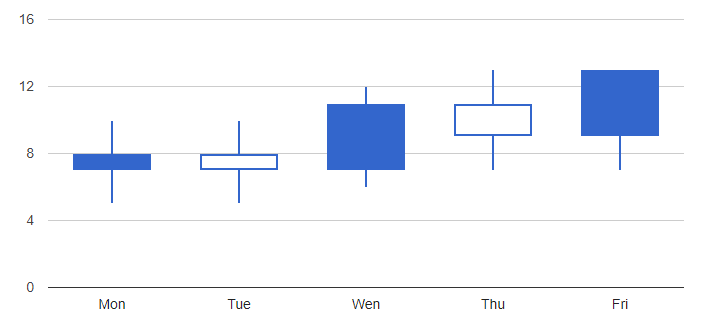
Optimal data structure (database):
label |
min |
max |
open |
close |
"Mon" |
5 |
10 |
7 |
8 |
"Tue" |
5 |
10 |
8 |
7 |
"Wen" |
6 |
12 |
7 |
11 |
"Thu" |
7 |
13 |
11 |
9 |
"Fri" |
7 |
13 |
9 |
13 |
Optimal object structure (Java)
public class CandlestickChartObject {
    private String caption;
    private Double min;
    private Double max;
    private Double open;
    private Double close;

    public String getCaption() {
        return this.caption;
    }

    public void setCaption(final String caption) {
        this.caption = caption;
    }

    public Double getMin() {
        return this.min;
    }

    public void setMin(final Double min) {
        this.min = min;
    }

    public Double getMax() {
        return this.max;
    }

    public void setMax(final Double max) {
        this.max = max;
    }

    public Double getOpen() {
        return this.open;
    }

    public void setOpen(final Double open) {
        this.open = open;
    }

    public Double getClose() {
        return this.close;
    }

    public void setClose(final Double close) {
        this.close = close;
    }
}
Example: Filling the data
final ChartModel model = ChartModel.New()
    .addColumn(Column.New(Type.STRING, "caption", "Caption"))
    .addColumn(Column.New(Type.NUMBER, "min value", "Lunte"))
    .addColumn(Column.New(Type.NUMBER, "max value", "Docht"))
    .addColumn(Column.New(Type.NUMBER, "open value", "Eröffnung"))
    .addColumn(Column.New(Type.NUMBER, "close value", "Schluss"));

model.addRow("Mon", 5, 10, 7, 8);
model.addRow("Tue", 5, 10, 8, 7);
model.addRow("Wen", 6, 12, 7, 11);
model.addRow("Thu", 7, 13, 11, 9);
model.addRow("Fri", 7, 13, 9, 13);

this.candlestickChart.setModel(model);