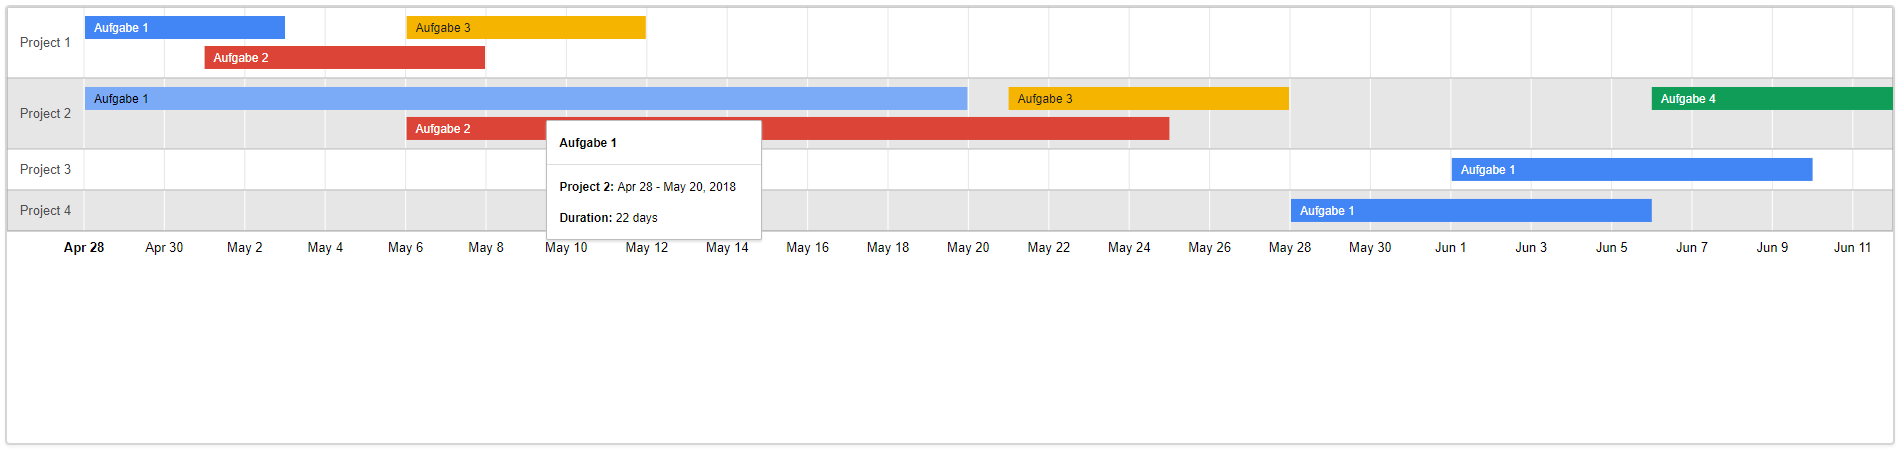
TimelineChart
Optimal data structure (database):
Category 1 - y-axis |
Category - x-axis |
Begin |
End |
Project 1 |
Task 1 |
28.04.2018 |
03.05.2018 |
Project 1 |
Task 2 |
01.05.2018 |
08.05.2018 |
Project 1 |
Task 3 |
06.05.2018 |
12.05.2018 |
Project 2 |
Task 1 |
28.04.2018 |
20.05.2018 |
Project 2 |
Task 2 |
06.05.2018 |
25.05.2018 |
Optimal object structure (Java):
public class TimelineChartObject {
    private String y_category;
    private String x_category;
    private LocalDate start;
    private LocalDate end;

    public String getX_category() {
        return x_category;
    }

    public void setX_category(String x_category) {
        this.x_category = x_category;
    }

    public String getY_category() {
        return y_category;
    }

    public void setY_category(String y_category) {
        this.y_category = y_category;
    }

    public LocalDate getStart() {
        return start;
    }

    public void setStart(LocalDate start) {
        this.start = start;
    }

    public LocalDate getEnd() {
        return end;
    }

    public void setEnd(LocalDate end) {
        this.end = end;
    }
}
Example filling the data:
//Erstellen Model
final ChartModel model = ChartModel.New()
    .addColumn(Column.New(Type.STRING, "project", "project"))
    .addColumn(Column.New(Type.STRING, "task", "Task"))
    .addColumn(Column.New(Type.DATE, "from", "From"))
    .addColumn(Column.New(Type.DATE, "to", "To"));

model.addRow("Project 1", "Aufgabe 1", LocalDate.of(2018, 4, 28), LocalDate.of(2018, 5, 3));
model.addRow("Project 1", "Aufgabe 2",LocalDate.of(2018, 5, 1), LocalDate.of(2018, 5, 8));
model.addRow("Project 1", "Aufgabe 3",LocalDate.of(2018, 5, 6), LocalDate.of(2018, 5, 12));
model.addRow("Project 2", "Aufgabe 1",LocalDate.of(2018, 4, 28), LocalDate.of(2018, 5, 20));
model.addRow("Project 2", "Aufgabe 2",LocalDate.of(2018, 5, 6), LocalDate.of(2018, 5, 25));
model.addRow("Project 2", "Aufgabe 3",LocalDate.of(2018, 5, 21), LocalDate.of(2018, 5, 28));
model.addRow("Project 2", "Aufgabe 4",LocalDate.of(2018, 6, 6), LocalDate.of(2018, 6, 12));
model.addRow("Project 3", "Aufgabe 1",LocalDate.of(2018, 6, 1), LocalDate.of(2018, 6, 10));
model.addRow("Project 4", "Aufgabe 1",LocalDate.of(2018, 5, 28), LocalDate.of(2018, 6, 6));

//Setzen des Models
timelineChart.setModel(model);
API and methods:
Properties |
|
AvoidOverlappingGridlines |
Google Charts makes tiny adjustments to the endpoints of the bars to avoid obscuring the gridlines of the timeline. To prevent this behavior, set the |
CustomizeTimeline |
Example More detailed information can be found at: https://developers.google.com/chart/interactive/docs/gallery/timeline |