BubbleChart
Optimal data structure (database):
| Label | X-Axis | Y-Axis | Category | BubbleSize |
|---|---|---|---|---|
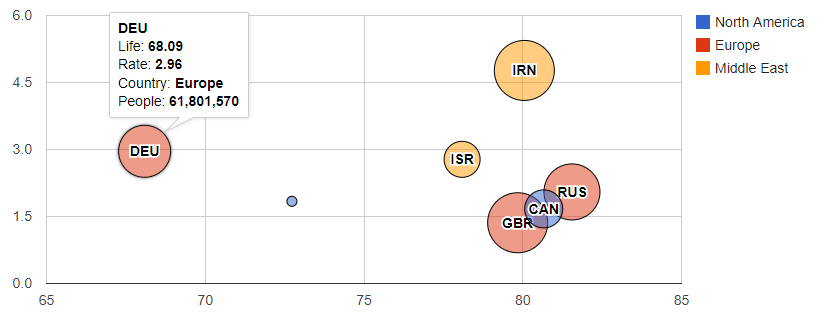
"DEU" |
68.49 |
2.96 |
"Europe" |
61801570 |
"GBR" |
79.66 |
1.67 |
"Europe" |
81902307 |
"ISR" |
78.09 |
2.78 |
"Middle East" |
31090763 |
… |
Optimal object structure (Java)
public class BubbleChartObject {
    private String description;
    private Double x_value;
    private Double y_value;
    private String category;
    private Double bubbleValue;

    public String getDescription() {
        return description;
    }

    public void setDescription(String description) {
        this.description = description;
    }

    public Double getX_value() {
        return x_value;
    }

    public void setX_value(Double x_value) {
        this.x_value = x_value;
    }

    public Double getY_value() {
        return y_value;
    }

    public void setY_value(Double y_value) {
        this.y_value = y_value;
    }

    public String getCategory() {
        return category;
    }

    public void setCategory(String category) {
        this.category = category;
    }

    public Double getBubbleValue() {
        return bubbleValue;
    }

    public void setBubbleValue(Double bubbleValue) {
        this.bubbleValue = bubbleValue;
    }
}
Example
// Create model
final ChartModel model = ChartModel.New()..addColumn(Column.New(Type.STRING, "bubbletext", "Bubbletext"))
    .addColumn(Column.New(Type.NUMBER, "x-value", "X-Axis"))
    .addColumn(Column.New(Type.NUMBER, "x-value", "Y-Axis"))
    .addColumn(Column.New(Type.STRING, "category", "Category"))
    .addColumn(Column.New(Type.NUMBER, "bubblesize", "Bubblesize"));

// Add items to model
model.addRow("CAN", 80.66, 1.67, "North America", 33739900d);
model.addRow("GBR", 79.84, 1.36, "Europe", 81902307d);
model.addRow("USA", 72.73, 1.84, "North America", 5523095d);
model.addRow("IRN", 80.05, 4.77, "Middle East", 79716203d);
model.addRow("DEU", 68.09, 2.96, "Europe", 61801570d);
model.addRow("RUS", 81.55, 2.05, "Europe", 73137148d);
model.addRow("ISR", 78.09, 2.78, "Middle East", 31090763d);

// Set model
this.bubbleChart.setModel(model);