MapsChart
Contents:
| For using the GeoChart or MapsChart a Google API-Key is required. This API key can be requested here. |
Optimal data structure (database):
Two alternative data formats are supported
-
Lat-Long pairs
Lat Long Label 37.4232
-122.0853
"Work"
37.4289
-122.1697
"University"
37.6153
-122.3900
"Airport"
…
-
String address
Address Label "Musterweg 16 92225 Musterndorf"
"Work"
Optimal object structure (Java)
// Lat-Long pairs
public class MapChartObject {
private Double longitude;
private Double latitude;
private String name;
public Double getLongitude() {
return longitude;
}
public void setLongitude(Double longitude) {
this.longitude = longitude;
}
public Double getLatitude() {
return latitude;
}
public void setLatitude(Double latitude) {
this.latitude = latitude;
}
public String getName() {
return name;
}
public void setName(String name) {
this.name = name;
}
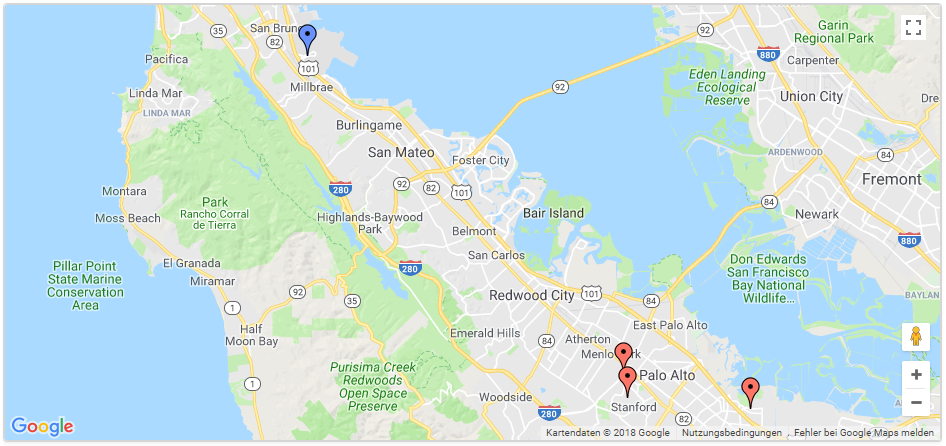
}Example
Example uses Lat-Long pairs
// Create model for Lat-Long data items
final ChartModel model = ChartModel.New()
    .addColumn(Column.New(Column.Type.NUMBER, "longitude"))
    .addColumn(Column.New(Column.Type.NUMBER, "latitude"))
    .addColumn(Column.New(Column.Type.STRING, "Beschriftung"));

// Add items to model
model.addRow(37.4232, -122.0853, "Work");
model.addRow(37.4289, -122.1697, "University");
model.addRow(37.6153, -122.3900, "Airport");
model.addRow(37.4422, -122.1731, "Shopping");

// Set model
mapChart.setModel(model);
API and methods
| Properties | |
|---|---|
API Key |
Some charts require an API key from Google. You can get a key here: https://developers.google.com/maps/documentation/javascript/get-api-key |
MapType |
The type of map to display. Possible values are "normal", "terrain", "satellite", "hybrid" or the ID of a custom map type if one has been created. |
ShowInfoWindow |
If this option is set to true, the location description is displayed in a separate window when the user selects a point marker. |
ShowLine |
If this option is set to true, a Google Maps polyline displayed through all points. |
ShowTooltip |
If this option is set to true, the location description is displayed as a tooltip when the mouse is over a point marker. Until version 45, this option was called |
UseMapTypeControl |
Displays a map type selector that allows the viewer to switch between [map, satellite, hybrid, terrain]. If useMapTypeControl is set to false (default), no selector is displayed and the type is determined by the mapType option. |
ZoomLevel |
An integer indicating the initial zoom level of the map, where 0 is a full zoom out (whole world) and 19 is the maximum zoom level. (See "Zoom levels" in the Google Maps API.) |
EnableScrollWheel |
When this option is set to true, zooming in and out using the mouse wheel is enabled. |