Entry
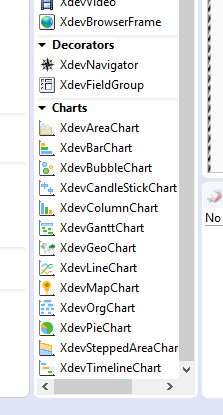
After the charts about the Dependency have been included in the POM.xml, they can be used via the palette.
-
Drag and drop the selected chart onto a container (Div, VerticalLayout, etc.) in the GUI Builder.
-
Take care of a suitable data preparation in advance, e.g. a query that returns the already consolidated data set for exactly this chart type.
-
Select an event or a time when the chart should be filled with the data and built.
-
Code examples can be found in the respective chart sections or in chapter API General, when it comes to the configuration of the charts which are the same for each chart type.