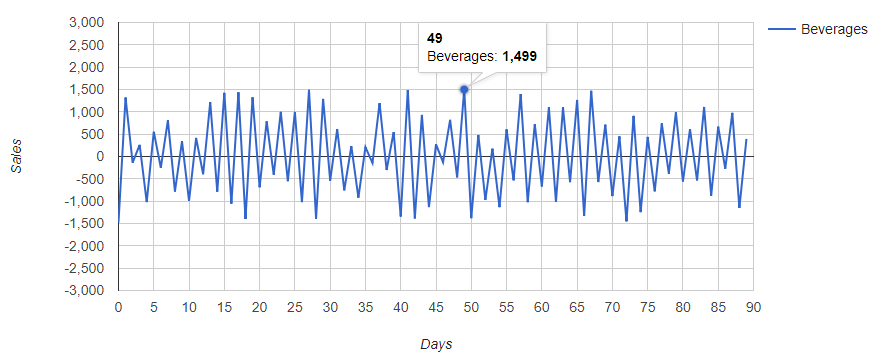
LineChart
Optimal data structure (database):
| Category | Y-Axis | X-Axis |
|---|---|---|
customers |
2013 |
4500 |
customers |
2014 |
9500 |
Customers |
2015 |
10850 |
… |
+ |
+ |
Sales |
2013 |
1200 |
Sales |
2014 |
8500 |
… |
+ |
+ |
Optimal object structure (Java):
public class LineChartObject {

    private String category;
    private String y_axis;
    private Integer x_axis;

    public String getCategory() {
        return this.category;
    }

    public void setCategory(final String category) {
        this.category = category;
    }

    public String getY_axis() {
        return this.y_axis;
    }

    public void setY_axis(final String y_axis) {
        this.y_axis = y_axis;
    }

    public Integer getX_axis() {
        return this.x_axis;
    }

    public void setX_axis(final Integer x_axis) {
        this.x_axis = x_axis;
    }
}
Example
// Create model
final ChartModel model = ChartModel.New()
    .addColumn(Column.New(Type.STRING, "year", "Jahr"))
    .addColumn(Column.New(Type.NUMBER, "sales", "Verkäufe"))
    .addColumn(Column.New(Type.NUMBER, "customer", "Kunden"));

// Add items to model
model.addRow("2013", "6500", 6500);
model.addRow("2014", "4321", 4321);
model.addRow("2015", "9460", 9460);
model.addRow("2016", "7450", 7450);

model.addRow("2013", "1500", 1500);
model.addRow("2014", "2850", 2850);
model.addRow("2015", "685", 685);
model.addRow("2016", "4850", 4850);

// Set model
lineChart.setModel(model);
API and methods
| Properties | |
|---|---|
PointShape |
The shape of each data element: "circle", "triangle", "square", "rhombus", "star" or "polygon". You can find detailed information here: https://developers.google.com/chart/interactive/docs/points |
PointSize |
Diameter of the displayed points in pixels. Use zero to hide all points. You can override the values for individual series with the 'series' property. If you use a trendline, the |
PointVisible |
Determines whether points should be displayed. Set to "false" to hide all points. |
LineDashStyle |
The in-and-out pattern for dashed lines. For example, |
LineWidth |
Data line width in pixels. Use zero to hide all lines and show only the points. Use the Series property to override the values for individual series. |
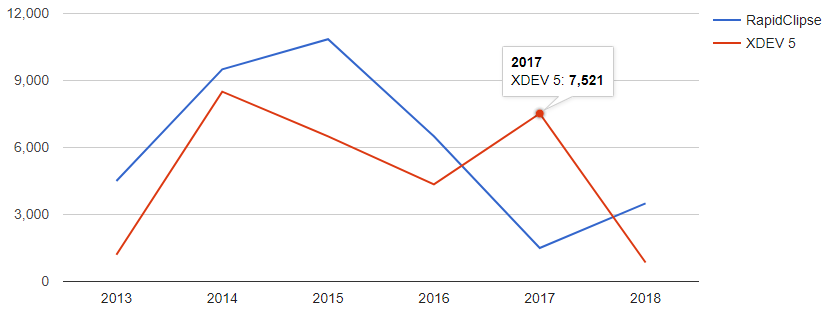
CurveType |
Controls the curve of the lines when the line width is not zero. Can be one of the following values: |
SelectionMode |
If |
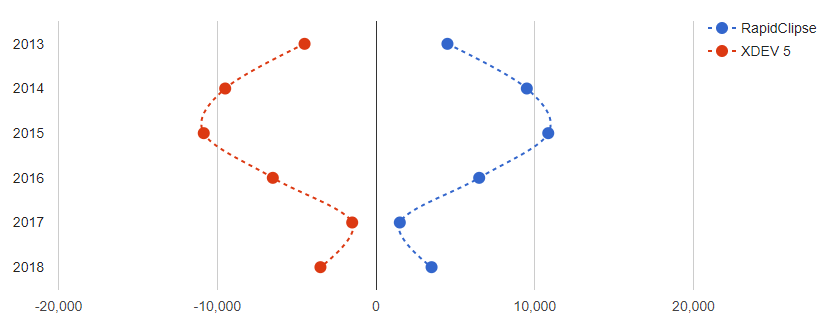
Orientation |
The orientation of the diagram. With the setting |
DataOpacity |
The transparency of the data points, where 1.0 is completely opaque and 0.0 is completely transparent. |