AreaChart
Contents:
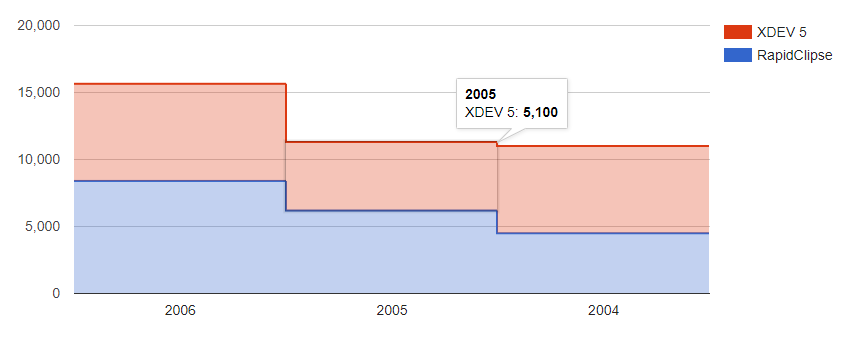
Note: Both charts XdevAreaChart and XdevSteppedAreaChart have the same implementations. Only the names change, but the settings are identical.
Optimal data structure (database):
| Category | Y-Axis | X-Axis |
|---|---|---|
customers |
2013 |
4500 |
customers |
2014 |
9500 |
customers |
2015 |
10850 |
… |
+ |
+ |
Sales |
2013 |
1200 |
Sales |
2014 |
8500 |
… |
+ |
+ |
Optimal object structure (Java)
public class AreaChartObject {
    private String category;
    private String y_axis;
    private Integer x_axis;

    public String getCategory() {
        return this.category;
    }

    public void setCategory(final String category) {
        this.category = category;
    }

    public String getY_axis() {
        return this.y_axis;
    }

    public void setY_axis(final String y_axis) {
        this.y_axis = y_axis;
    }

    public Integer getX_axis() {
        return this.x_axis;
    }

    public void setX_axis(final Integer x_axis) {
        this.x_axis = x_axis;
    }
}
Example
// Create model
final ChartModel model = ChartModel.New()
.addColumn(Column.New(Type.STRING, "year", "Jahr"))
.addColumn(Column.New(Type.NUMBER, "sales", "Verkäufe"))
.addColumn(Column.New(Type.NUMBER, "customer", "Kunden"));
// Add items to model
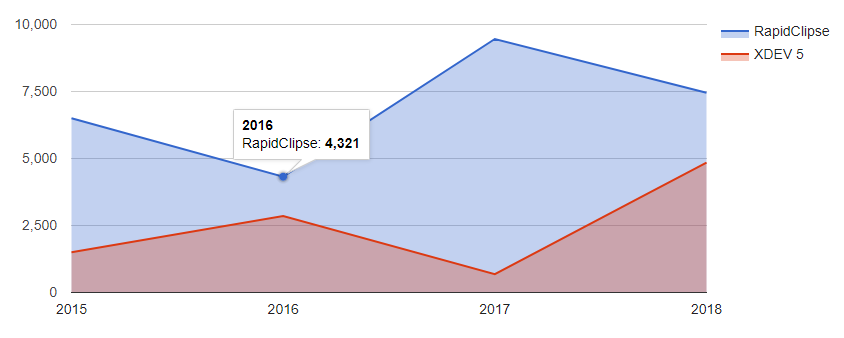
model.addRow("2013", "6500", 6500);
model.addRow("2014", "4321", 4321);
model.addRow("2015", "9460", 9460);
model.addRow("2016", "7450", 7450);
model.addRow("2013", "1500", 1500);
model.addRow("2014", "2850", 2850);
model.addRow("2015", "685", 685);
model.addRow("2016", "4850", 4850);
// Set data
areaChart.setModel(model);API and methods:
Configuration lines and points
| Properties | |
|---|---|
PointShape |
The shape of individual data elements: 'circle', 'triangle', 'square', 'diamond', 'star', or 'polygon'. For detailed information see: https://developers.google.com/chart/interactive/docs/points |
PointSize |
Diameter of displayed points in pixels. Use zero to hide all points. You can override values for individual series using the |
PointVisible |
Determines whether points will be displayed. Set to |
LineDashStyle |
The on-and-off pattern for dashed lines. For instance, |
LineWidth |
Data line width in pixels. Use zero to hide all lines and show only the points. You can override values for individual series using the |
SelectionMode |
When |
Orientation |
The orientation of the chart. When set to |
DataOpacity |
The transparency of data points, with 1.0 being completely opaque and 0.0 fully transparent. |