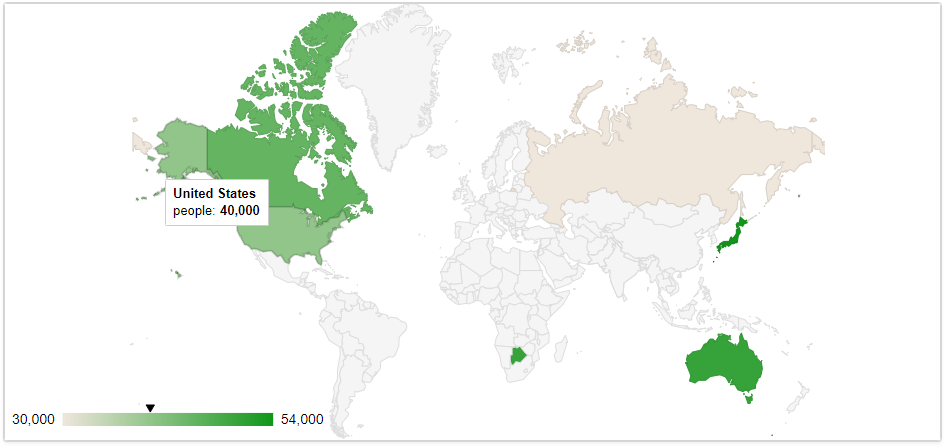
GeoChart
Contents:
| For using the GeoChart or MapsChart a Google API-Key is required. This API key can be requested here. |
Optimal data structure (database):
| Labeling | X-Axis |
|---|---|
"United States" |
327414000 |
"Japan" |
126490000 |
"Russia" |
146877088 |
… |
Optimal object structure (Java)
public class GeoChartObject {
    private String country;
    private Integer value;

    public String getCountry() {
        return country;
    }

    public void setCountry(String country) {
        this.country = country;
    }

    public Integer getValue() {
        return value;
    }

    public void setValue(Integer value) {
        this.value = value;
    }
}
Here you can find a list of all valid codes and countries: Country codes
Example
// Create model
final ChartModel model = ChartModel.New()
    .addColumn(Column.New(Column.Type.STRING, "Country"))
    .addColumn(Column.New(Column.Type.NUMBER, "Popularity"));

// Add items to model
model.addRow("Germany", 200);
model.addRow("United States", 300);
model.addRow("Brazil", 400);
model.addRow("Canada", 500);
model.addRow("France", 600);
model.addRow("RU", 700);
API and methods
| Properties | |
|---|---|
API Key |
Some charts require an API key from Google. You can get a key here: https://developers.google.com/maps/documentation/javascript/get-api-key |
DatalessRegionColor |
Color assigned to the regions without associated data. |
DefaultColor |
The color to use for data points in a "geochart" when the location (e.g. |
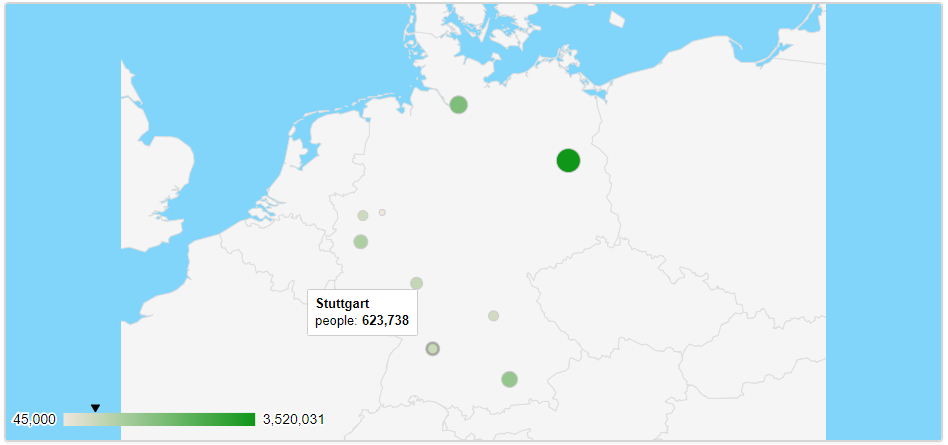
DisplayMode |
What kind of "Geochart" it is. The DataTable format must match the specified value. The following values are supported:
|
MarkerOpacy |
The opacity of the markings, where 0.0 stands for completely transparent and 1.0 for completely opaque. |
Resolution |
The resolution of the "Geochart" borders. Choose one of the following values:
|
MagnifyingGlass |
If this option is enabled, a magnifying glass will open when the user hovers over an overloaded marker. Note: This feature is not supported in browsers that support SVG do not support, i.e. Internet Explorer version 8 or earlier. |