TreeMapChart
General
More detailed information can be found here: https://developers.google.com/chart/interactive/docs/gallery/treemap
Example
// Create model
final ChartModel model = ChartModel.New()
.addColumn(Column.New(Column.Type.STRING, idColumn))
.addColumn(Column.New(Column.Type.STRING, parentIdColumn))
.addColumn(Column.New(Column.Type.NUMBER, sizeColumn));
// Add items to model
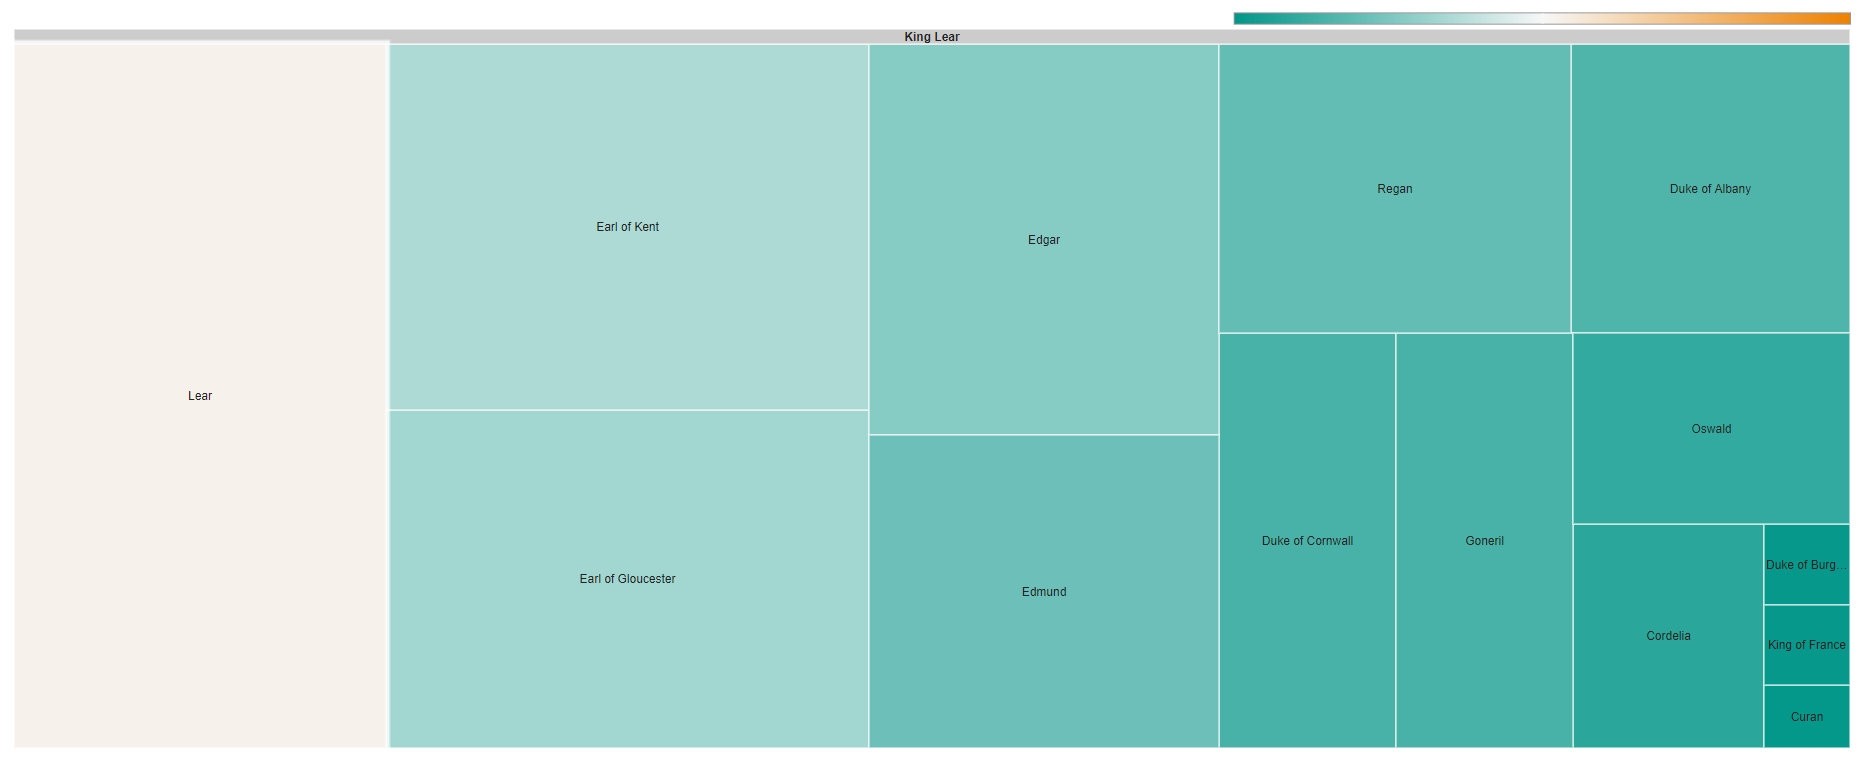
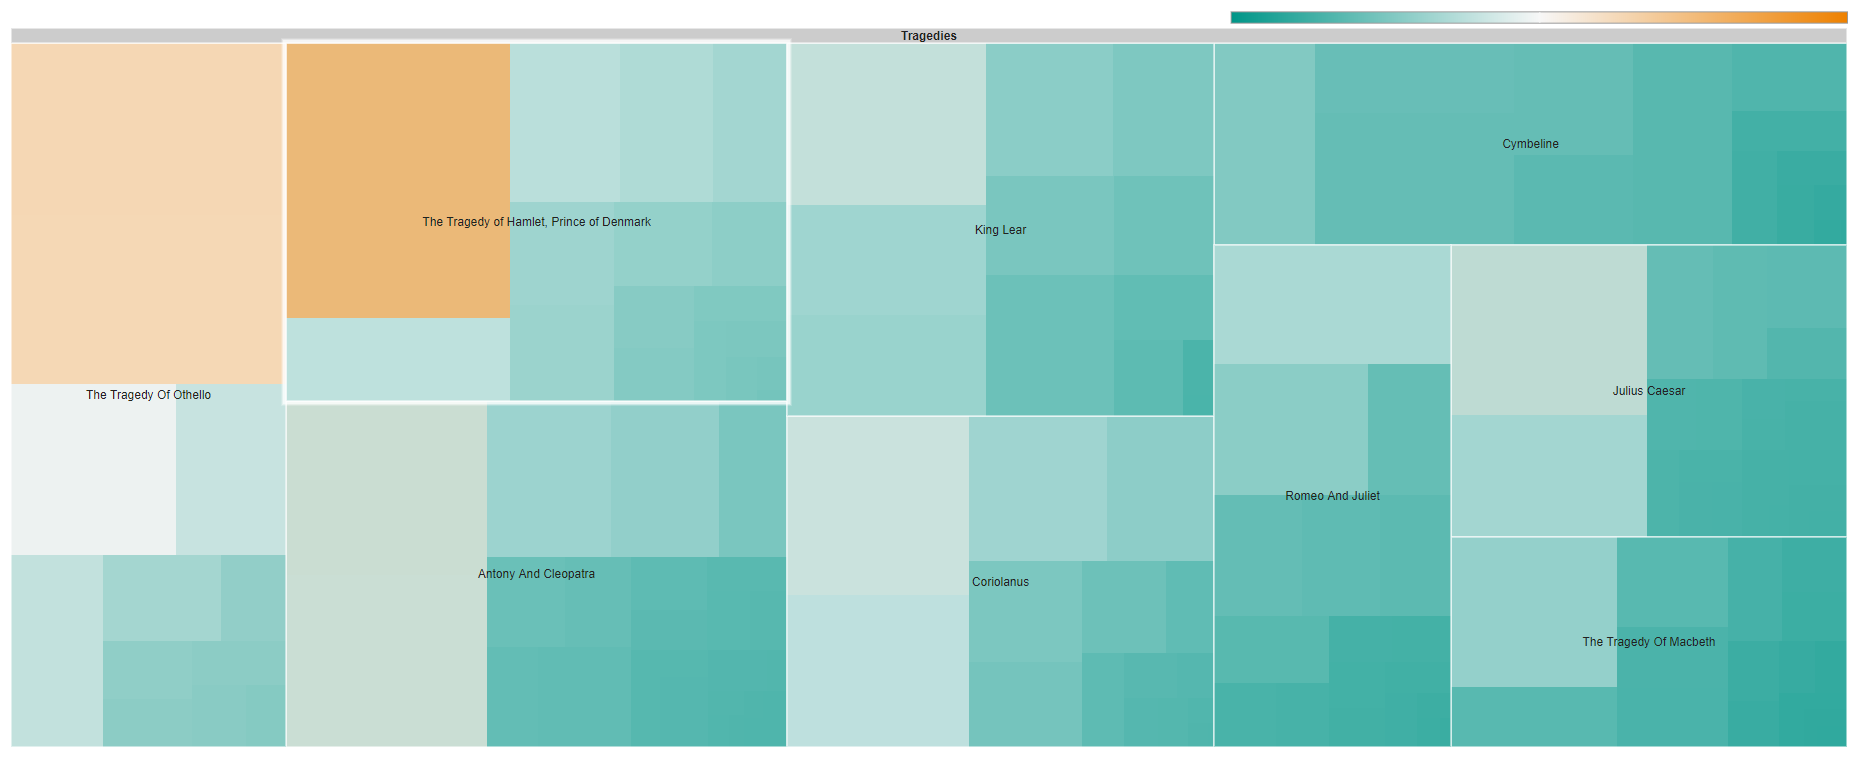
model.addRow("Shakespeare", null, 0);
model.addRow("Comedies", "Shakespeare", null);
model.addRow("Tragedies", "Shakespeare", null);
model.addRow("Histories", "Shakespeare", null);
model.addRow("As You Like It", "Comedies", null);
model.addRow("Adam", "As You Like It", 10);
model.addRow("Amiens", "As You Like It", 10);
model.addRow("Audrey", "As You Like It", 12);
model.addRow("Celia", "As You Like It", 108);
model.addRow("Charles", "As You Like It", 8);
model.addRow("Corin", "As You Like It", 24);
model.addRow("Dennis", "As You Like It", 2);
model.addRow("Duke", "As You Like It", 32);
model.addRow("Frederick", "As You Like It", 20);
model.addRow("Hymen", "As You Like It", 1);
model.addRow("Jaques (lord)", "As You Like It", 57);
model.addRow("Jaques (son)", "As You Like It", 2);
model.addRow("Le Beau", "As You Like It", 14);
model.addRow("Oliver", "As You Like It", 37);
model.addRow("Orlando", "As You Like It", 120);
model.addRow("Phebe", "As You Like It", 23);
model.addRow("Rosalind", "As You Like It", 201);
model.addRow("Silvius", "As You Like It", 24);
model.addRow("Sir Oliver Martext", "As You Like It", 3);
model.addRow("Touchstone", "As You Like It", 74);
model.addRow("William", "As You Like It", 11);
model.addRow("Comedy Of Errors", "Comedies", null);
model.addRow("Adriana", "Comedy Of Errors", 79);
model.addRow("Aegeon", "Comedy Of Errors", 17);
model.addRow("Aemilia", "Comedy Of Errors", 16);
model.addRow("Angelo", "Comedy Of Errors", 31);
// Set model
treeMapChart.setModel(model);API and methods
| Properties | |
|---|---|
HeaderColor |
The color of the header for each node. Specify an HTML color value. |
HeaderHeight |
The height of the header area for each node, in pixels (can be zero). |
HeaderHighlightColor |
The color of the header of a node over which the mouse pointer is moved. Specify an HTML color value or zero; if zero, the "headerColor" value is lightened by 35%. |
HighlightOnMouseOver |
Sets whether elements should be highlighted when hovering over them with the mouse. If set to |
HintOpacity |
If |
Max / Mid / MinColor |
The color for a rectangle with a value in column 3 of "maxColorValue". Specify an HTML color value. |
MaxDepth |
The maximum number of node planes to display in the current view. The levels are flattened to the current level. If your tree has more levels, you must go up or down to see them. Levels below that are additionally displayed as shaded rectangles within those nodes. |
Max / Mid / MinHighlightColor |
Sets the horizontal scroll position in pixels if the table has horizontal scrollbars because you have set the width property. The table is scrolled that many pixels beyond the leftmost column. |
MaxPostDepth |
How many levels of nodes beyond |
NoColor |
The color to use for a rectangle when a node has no value for column 3 and that node is a leaf (or contains only leaves). Specify an HTML color value. |
NoHightlightColor |
The color to use for a rectangle with the color "no" when it is highlighted. Specify an HTML color value or null; null lightens the value of "noColor" by 35%. |
ShowScale |
Whether or not to display a gradient scale from |
ShowTooltip |
Whether tooltips should be displayed. |