GaugeChart
General
More detailed information can be found here: https://developers.google.com/chart/interactive/docs/gallery/gauge
Example
// Create model
final ChartModel model = ChartModel.New()
.addColumn(Column.New(Column.Type.STRING, "label"))
.addColumn(Column.New(Column.Type.NUMBER, "value"));
// Add items to model
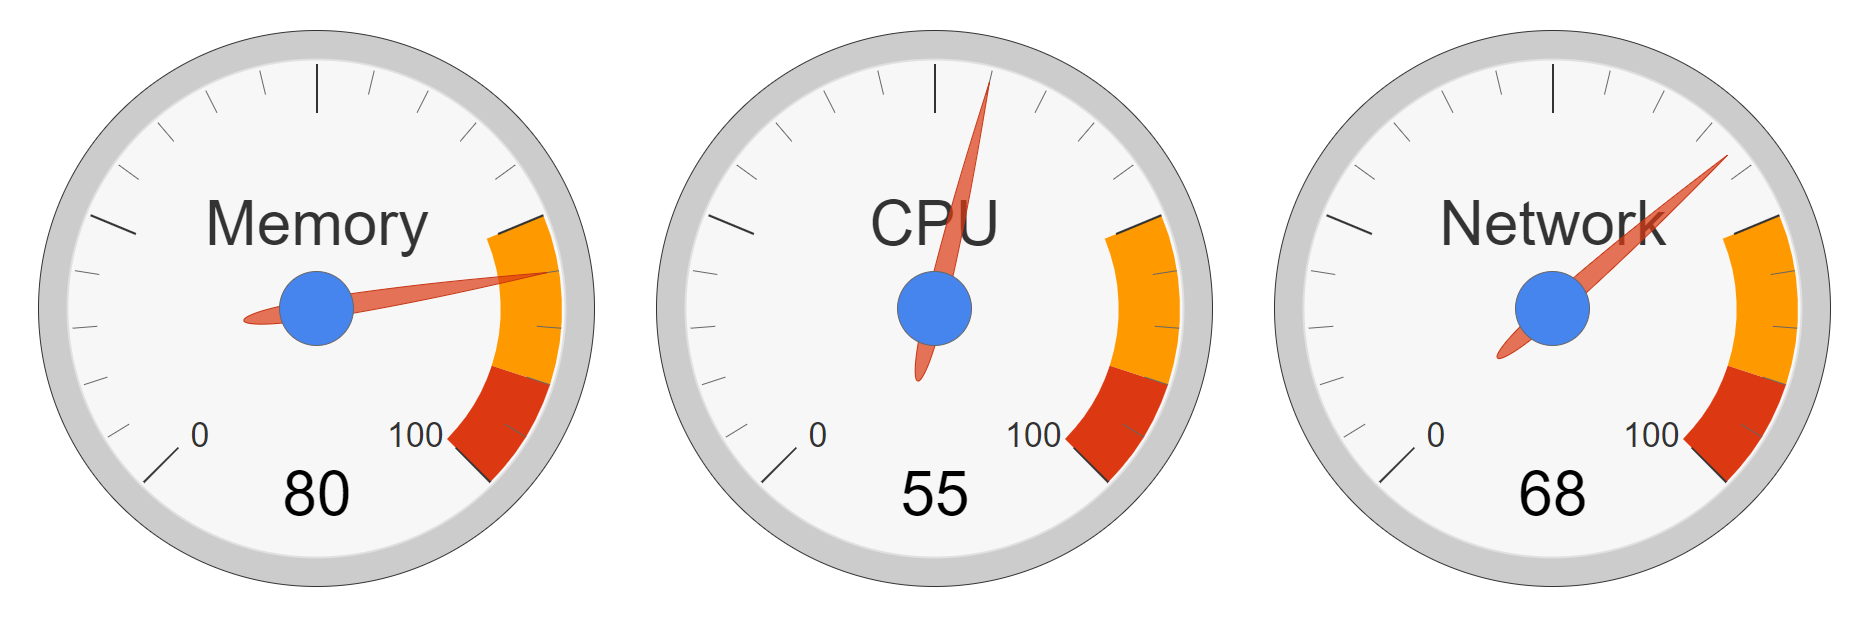
model.addRow("Memory", 80);
model.addRow("CPU", 55);
model.addRow("Network", 68);
// Set model
this.gaugeChart.setModel(model);API and methods
| Properties | |
|---|---|
GreenColor, YellowColor, RedColor |
The color to use for the green, yellow and red section, in HTML color notation. |
GreenFrom, YellowFrom, RedFrom |
The lowest value for an area marked by a green, yellow or red color. |
GreenTo, YellowTo, RedTo |
The highest value for an area marked by a green, yellow or red color. |
MajorTicks |
Labels for the main tick marks. The number of labels sets the number of major tick marks in all gauges. The default setting is five major ticks, with the minimum and maximum measurement labels. |
MinorTicks |
The number of smaller tick sections in each larger tick section. |
AnimationDuration |
The duration of the animation, in milliseconds. Details can be found under the animation documentation. |
AnimationEasing |
The "easing function" applied to the animation. The following options are available:
|